Before the evidence, a distinction about kinds of evidence. The figures in this item are reference studies on measurement validity — whether these markers distinguish cognitive decline. Whether daily cognitive-stimulation engagement is beneficial (the intervention evidence: WHO guidance, Cochrane review) is a separate question — see 'Designed on established ground' below. Keeping that distinction sharp is a rule we hold ourselves to.
🧠 Memory — core axis. What: how well a story holds together in meaning. How: ko-SBERT (an embedding model that represents the meaning of Korean sentences as vectors) computes semantic similarity between adjacent sentences (coherence), alongside the number of semantic clusters and repetition of the same content (perseveration). Evidence: in story-recall tasks, coherence markers distinguished healthy older adults from cognitive decline (including AD and MCI) at AUC 0.84 (Clarke et al., 2021). Cluster counts (Cintoli et al., 2024) and the memory-loading of perseveration (Pakhomov et al., 2018) provide supporting evidence.
📖 Vocabulary — core axis. What: diversity of word use and part-of-speech composition. How: KoNLPy (Mecab) morphological analysis extracts content-word lemmas, from which we compute MATTR and MTLD — lexical-diversity measures designed not to distort with utterance length. We rejected simple TTR because it swings with length, misreading “a quiet day” as vocabulary decline. Evidence: semantic-fluency (word-retrieval) models reach AUC 0.91 — the strongest single signal in the reference literature (Kaser et al., 2024).
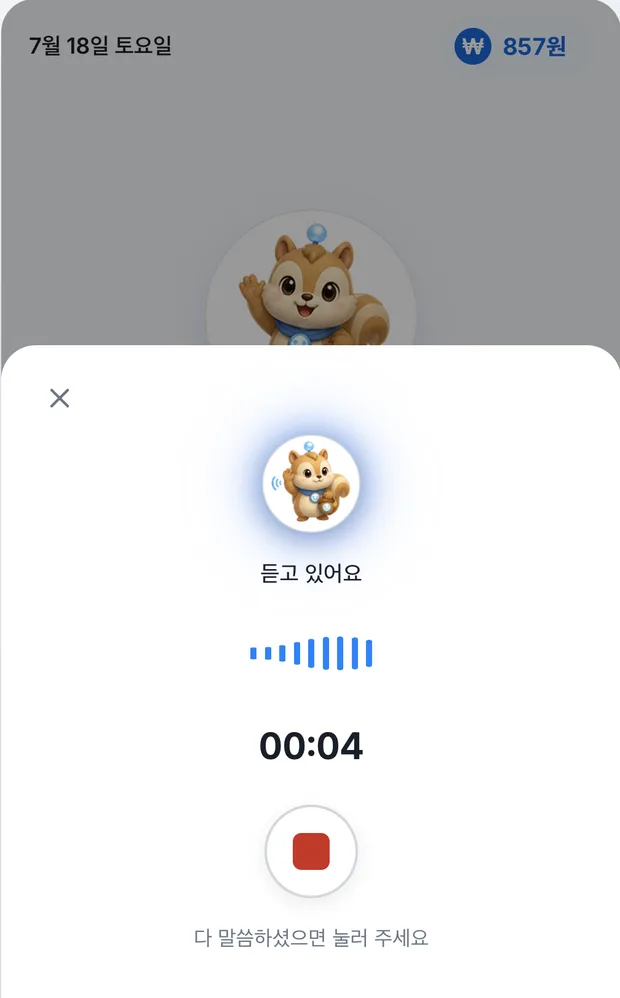
🗨️ Conversational flow — reinforcing axis. What: response latency and the rhythm of speech. How: because the AI is the conversation partner, the system knows exactly when its question ends — a uniquely clean measurement setting where response latency carries no speaker-separation error. Parselmouth (the Python interface to Praat, the standard phonetics toolkit) analyses inter-pausal units (IPUs) and pause structure. Evidence: conversational-timing markers distinguish cognitive decline at AUC 0.80 (De Looze et al., 2021). One caveat we state plainly: that figure comes from human-to-human conversation research, and human-to-AI conversation requires calibration — which is on our own validation list.
Speech — supporting axis. What: speech rhythm (articulation time, pause ratio). How: derived from word-level timestamps of the speech-to-text output. Acoustic features (timbre, tremor) are not computed in the current version.
The axes themselves are an audited choice. An earlier 'attention' axis was removed from display after we concluded its signal overlaps memory and executive function — no independent information. And because the literature cannot fix weights across four axes (each study differs in cohort and task), we do not hard-code them; they are learned from our own baselines as deployment data accumulates.
A single score is not a signal. One conversation's score is one point on that person's baseline. What matters is a gradual longitudinal departure from their own baseline — which is why the pipeline is built not as a score calculator but as session → markers → personal time series → change detection.
Honest limits, stated ambition. The AUC figures above are reference results from different studies, cohorts and tasks — not clinical validation of the E:go pipeline itself. Korean older-adult norms and education adjustment are still being established, so the current version trusts within-person change only, never absolute scores. Claiming early detection of cognitive change is a goal we intend to earn — through concurrent- and predictive-validity studies and the software-as-a-medical-device (SaMD) regulatory pathway — not a claim we make today.
Sources
- Clarke et al., 2021
- Cintoli et al., 2024
- Pakhomov et al., 2018
- Kaser et al., 2024
- De Looze et al., 2021 · Front. Aging Neurosci. 13:637404